
Immigration and Population by the Numbers
Written by HAHS Staff | Download a PDF of this article
Telling the story of Hayward’s immigration and diversity is a difficult task. While we have the U.S. Census and a few other documents to work with, shifting definitions of what it means to be White, Latino, Asian, among other identities, make it difficult to give a definitive picture. What is clear however, is from the beginning, the Hayward area has benefitted from a wide array of immigrants bringing their values and perspectives to the area.

A photo of Hayward’s Hotel, 1876. Chinese members of the hotel staff can be seen standing side-by-side on the right.
In the Hayward area, the immigration and population figures are similar to broader California patterns. An 1870 population count revealed a total population of 504 people. Interestingly, 305 were born in the U.S., while 199 were foreign born—or more than one-third of Hayward. All told, 487 of the population were considered white, and 17 listed as “Chinese”. Although the community was mostly white, there would have been a diverse array of languages and distinct cultural and religious traditions. Many residents were speaking Portuguese, German, Danish and some Spanish, in addition to the Cantonese or other dialects Chinese immigrants may have spoken.
Through the turn-of-the-20th century several unofficial surveys captured the changes in Hayward’s immigration and diversity. A 1938 survey titled “Ancestral Background Hayward High School Student Body—1938” reveals more of the area's lingual diversity. More than half of the students claimed both parents were foreign born compared to just a quarter in the rest of Alameda County. And while most students stated that English was spoken at home, there were a varied array of languages spoken at home by the roughly one-fifth who spoke another. These languages included Portuguese, Spanish, Japanese, and Italian. And while the total population of Hayward was less than 7,000, the amount of lingual diversity separates Hayward from the rest of California.

Hayward Union High School in the 1930s. At that time, more than half of the students had a parent born in another country.
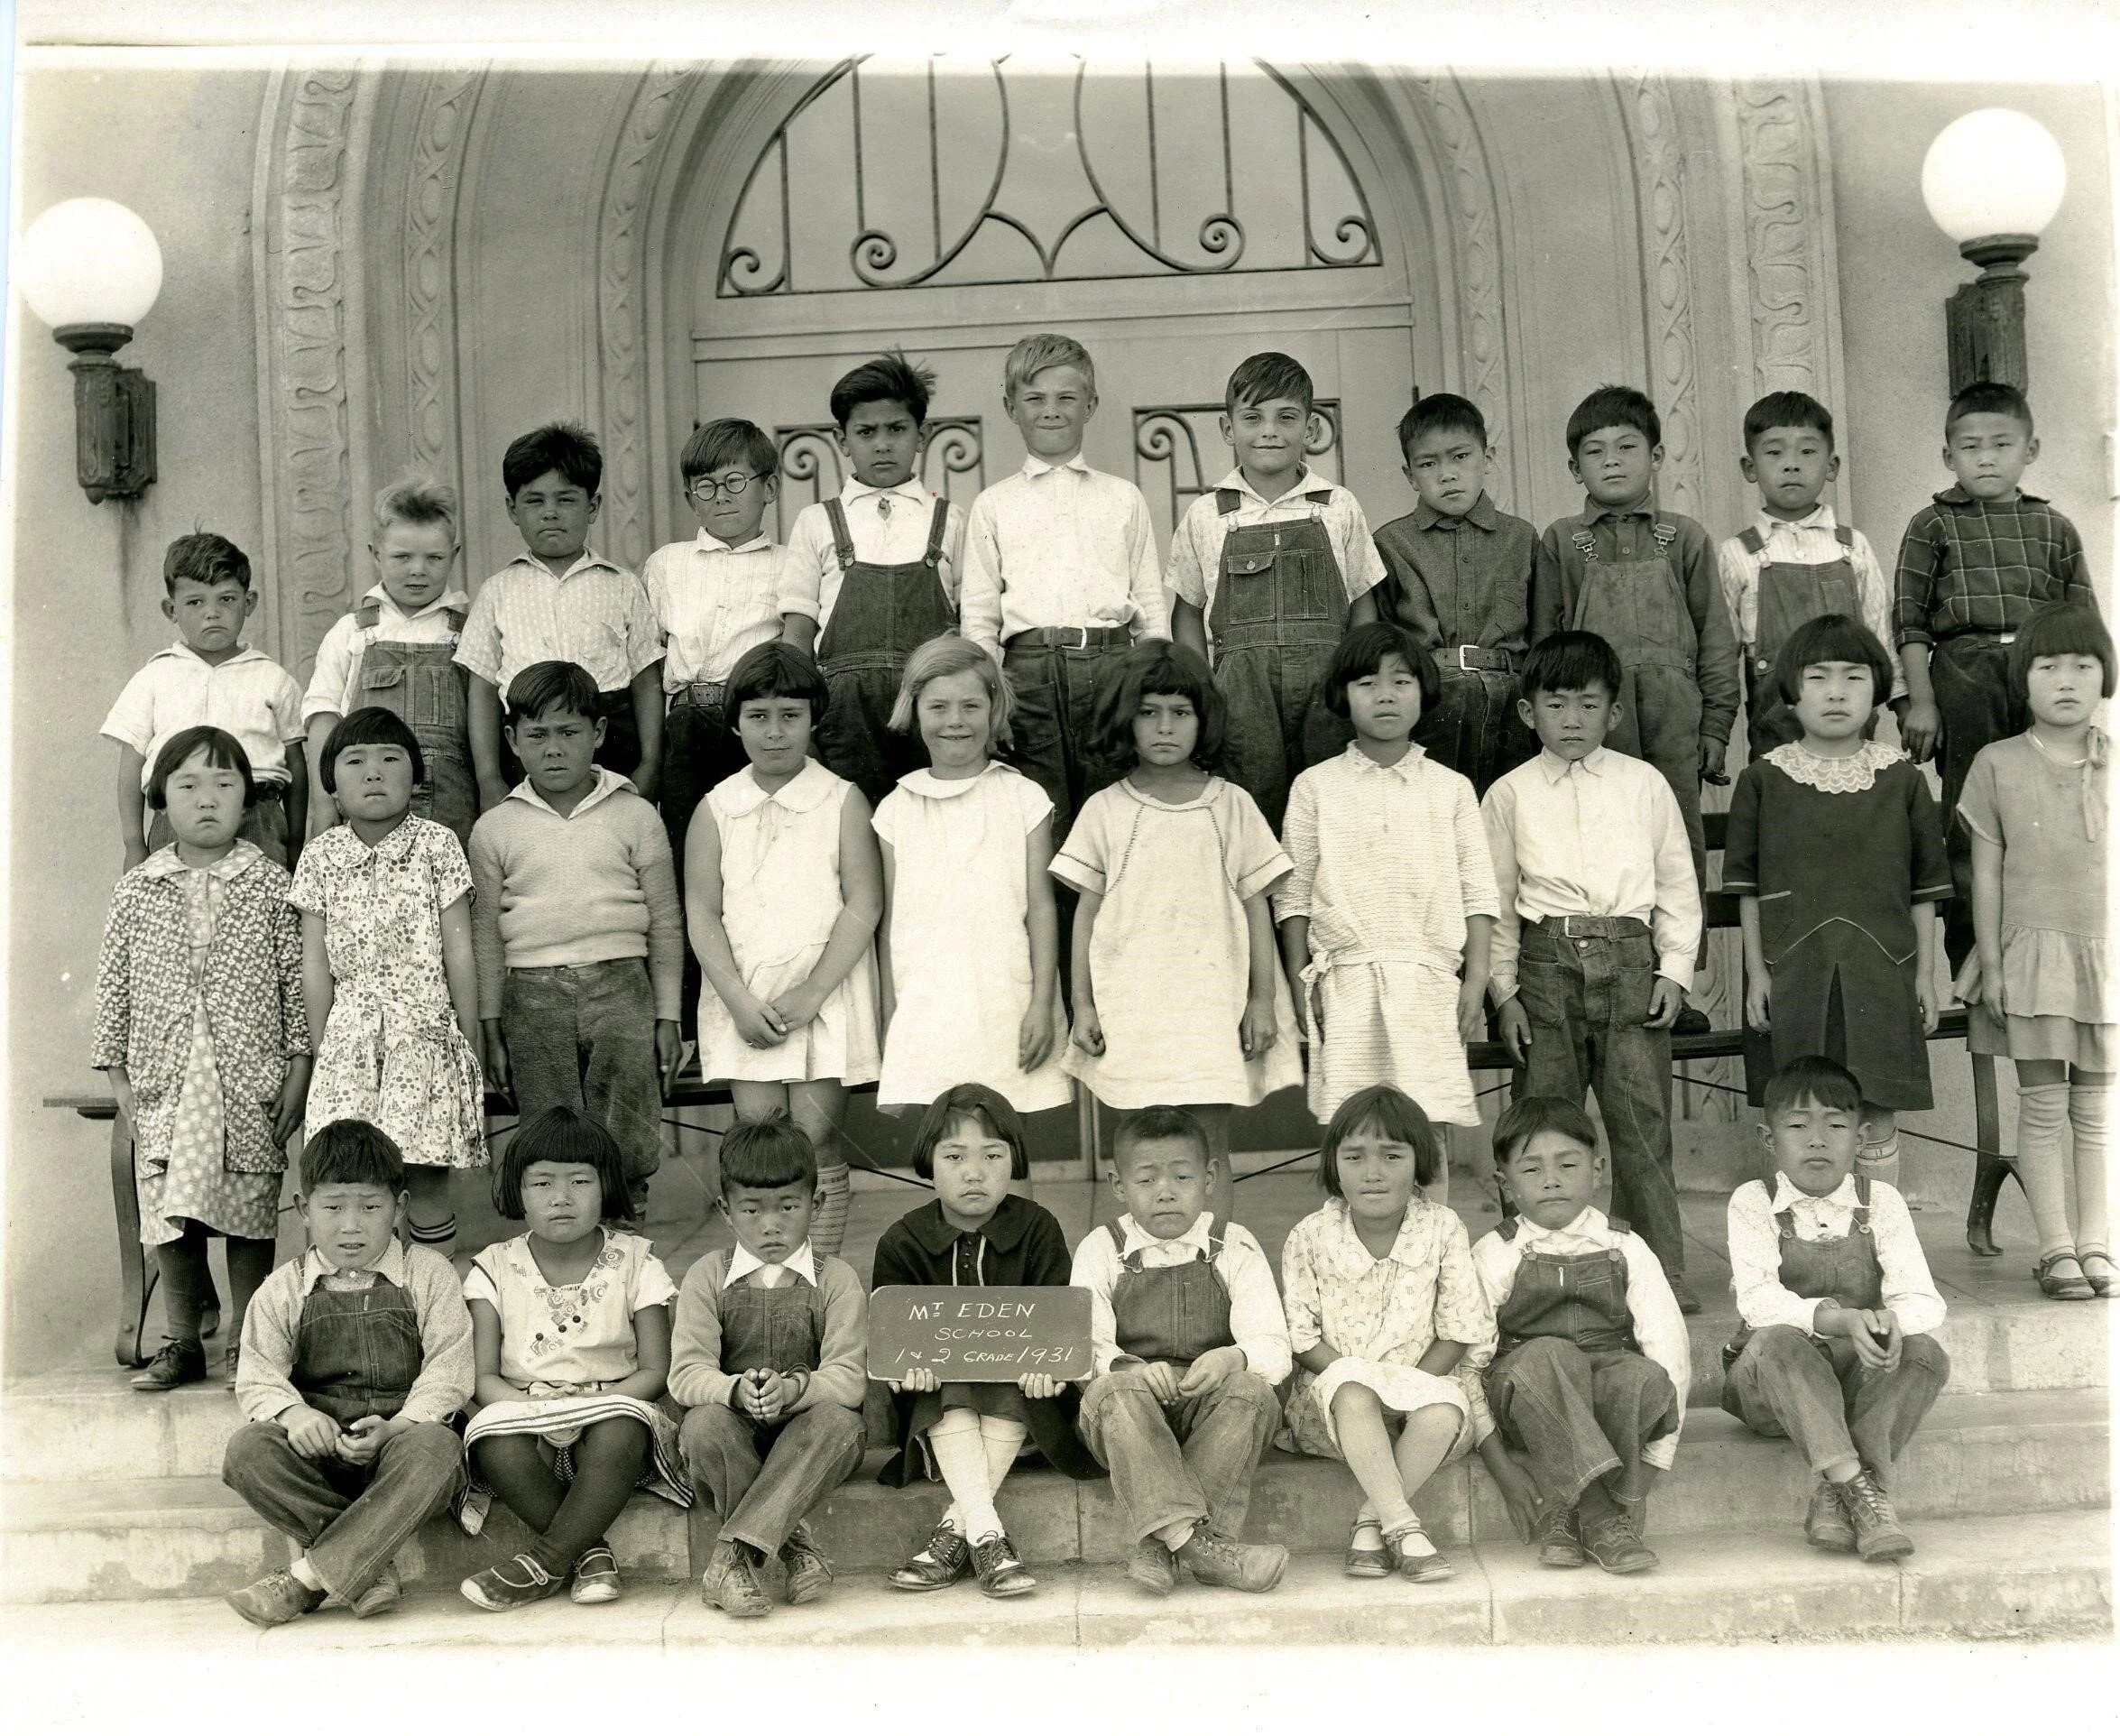
First and second graders at Mt. Eden Grammar School, 1931. Mt. Eden saw a large increase in its Japanese and Japanese American population in the 1910s, 1920s, and 1930s.
From 1870 and 1940, Hayward’s population rose consistently, if not exponentially each decade. After World War II Hayward's population and its diversity increased dramatically. A 1953 United States Department of Commerce census highlights Hayward's rapid growth. In 1940, before World War II, about 6,736 people lived in Hayward. A decade later that number more than doubled to 14,271 people. Three years later another 10,000 people brought the population to 24,292. Only two years later, the population would grow by another 10,000. Amazingly, Hayward’s population jumped by 20,000 between 1950 and 1955—a product of suburban housing development and the “baby boom”.
Despite all the growth, Hayward remained a mostly white community after World War II, with several minority groups living outside the city limits in unincorporated areas. In 1953, for example, with a population of 24,292 people, only 91 people living in the Hayward city limits were counted as “non-white”.

Graduates of Russell School, c. 1955. Racial steering meant people of color often resided outside the Hayward City Limits.
Since the 1950s however, Hayward has seen growth in its diversity. Perhaps most dramatic are the changes that have taken place between the 1990 and 2010s. For example, between 1992 and 2011 the white population went from about 51 percent to about 19 percent. Only ten years before in 1980 “white” made up about 65 percent of Hayward’s population. At the same time (1992-2011) the Hispanic/Latino population grew from 23 percent to about 40 percent. Hispanic/Latino today make up the largest demographic in Hayward.
Blanket terms such as “Asian” also hide some of Hayward’s recent demographic shifts. For example, Filipino, Chinese, Asian Indian, Vietnamese, Japanese, Korean, Hawaiian, Guamanian and Samoan are all represented in Hayward and all saw increases in the populations between 1980 and 1990, with the exception of Guamanians. Overall, Hayward’s Asian population grew by more than 100 percent, comprising almost 15 percent of the total population by 1990.
More recent population statistics also tell us more about the surrounding unincorporated communities. San Lorenzo for example has seen its foreign born population rise from about 21 percent to about 31 percent between 1990 and 2009. This group of about 7,000 came mostly from Mexico and the Philippines, with a smaller amount coming from China and Vietnam. Elsewhere the Asian population has grown even more quickly. In Castro Valley for example the Asian population grew from about 13 percent to about 25 percent of the population between 2000 and 2011.
In summary, Hayward’s growth has been more or less consistent with the state of California. At its founding, Hayward had a large amount of lingual diversity, but consisted mostly of European groups classified as “white” by the United States Census. The majority of Hayward’s population remained white, with minorities being pushed out to the surrounding unincorporated areas. In the post-war era Hayward began to diversify more quickly. By 2000, Hayward crossed a significant threshold when the majority of the population was no longer white. And significantly, no other single ethnic group represents over 50 percent of the city’s population. Hayward’s diversification may have originally been predominantly lingual, but the community has slowly transitioned into one of the most culturally diverse communities in the United States.
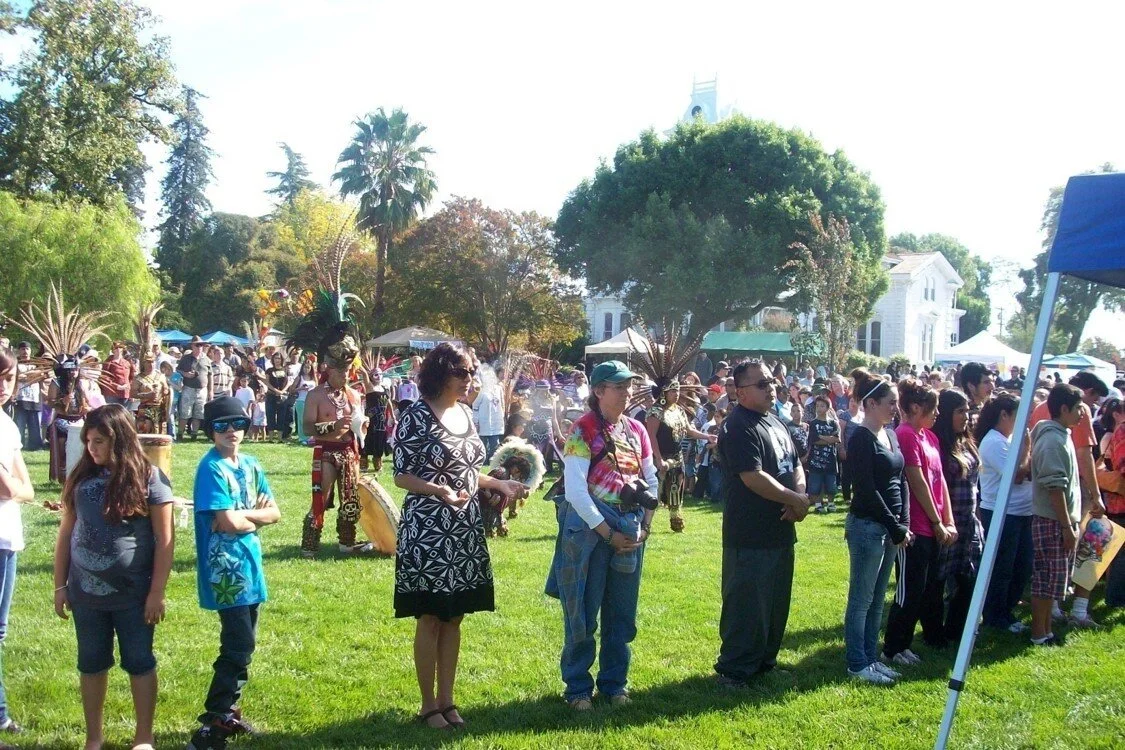
A gathering at the Meek Estate, c. 2009. By 2000, the Hayward area could claim to be one of the most diverse areas in the United States.